Revealing the bar at the heart of the Milky Way
The kinematics of the Solar neighbourhood shows rich substructure in the form of streams or moving groups (see below Figure). One such stream, Hercules, consists of stars Vphi ∼ 200 km s−1, where Vphi is velocity in the direction of Galactic rotation. It has been proposed that Hercules is a result of the outer Lindblad resonance (OLR) of the Galactic bar (Dehnen 2000). This arises naturally from resonant interaction between the disc and a short (e.g. ∼3.5 kpc) fast rotating bar, as further explored in e.g. Antoja et al. (2014) and Monari et al. (2017c).
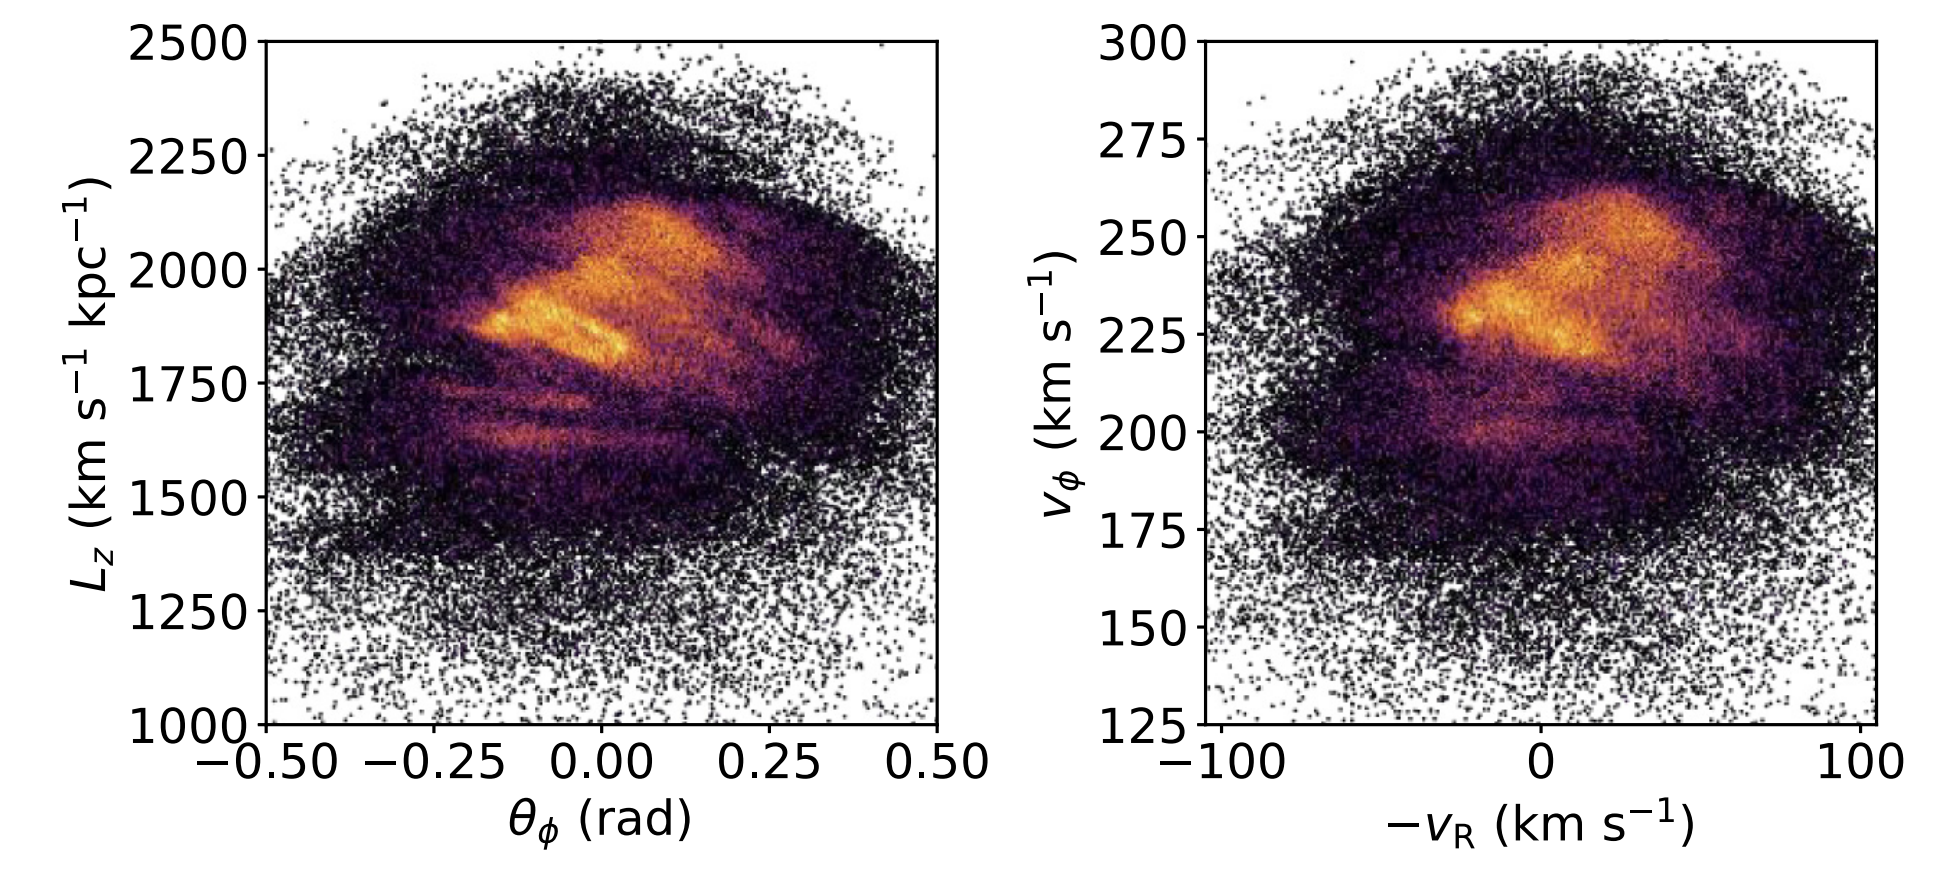
Radial vs. azimuthal velocity for stars within 250 pc, from Gaia DR2 (right). The features are sharper when plotted instead in azimuthal phase-angle vs. angular momentum (see Hunt et al. 2020).
However, if the bar is longer (e.g. ∼5 kpc), as favoured by more recent measurements of its extent (e.g. Wegg, Gerhard & Portail 2015), then the bar must rotate slower, because the furthest the bar can extend is corotation (e.g. Contopoulos 1980). For such a bar, the OLR is located at a Galactocentric radius of around 10.5 kpc, making it unable to account for the Hercules stream (although note that a possible OLR feature has been observed around 10–11 kpc in Liu et al. 2012).
Perez-Villegas et al. (2017) present an alternative explanation for the Hercules stream arising from a bar with a half length of 5 kpc. In this model, stars orbiting the bar’s Lagrange points L4 and L5 move outwards from corotation which occurs at R = 6 kpc to pass through the Solar neighbourhood. However, explorations of the distribution function in the outer disc for a long-slow bar model, either show no Hercules-like feature (e.g. Monari et al. 2017b), or one which is substantially weaker (Monari et al. 2017a; Binney 2018) than is seen in either the model from Perez-Villegas et al. (2017), or the Solar neighbourhood. These models typically use a simple quadrupole bar potential (e.g. from Dehnen 2000), which is a simple approximation for the complex structure in the inner Galaxy.
While the exact morphology of the bar is not yet fully constrained, various studies favour a more complicated potential than is given by the Dehnen bar. For example, the Milky Way appears to host an X-shaped bulge (e.g. Ness & Lang 2016) such as is often seen in external galaxies (e.g. Lutticke, Dettmar & Pohlen 2000) and can be easily created in N-body simulations (e.g. Combes & Sanders 1981; Athanassoula 2005; Abbott et al. 2017). Fourier decomposition of the density distribution in simulated (e.g. Athanassoula & Misiriotis 2002) and observed (e.g. Quillen, Frogel & Gonzalez 1994; Buta et al. 2006; Dıaz-Garcıa, Salo & Laurikainen 2016) barred disc galaxies show evidence for higher order modes than the m = 2 Dehnen bar. Thus, it is possible that the long-slow bar scenario does not predict a Hercules-like stream due to the simplicity of the assumed bar potential.
In Hunt and Bovy (2018) we showed that when including higher order structural components of a galactic bar, we can reconcile the kinematic substructure observed in the Solar neighbourhood with the length and pattern speed favored by direct measurements. The below Figure shows the expected kinematics from the 2:1 Outer Lindblad Resonance (OLR) of a short fast bar (upper row) the corotation resonance (CR) of a long slow bar (middle row) and the 4:1 OLR of an intermediate bar with a m=4 fourier component (lower row) for a variety of Galactic azimuths. The phi=0 and pi columns should be representitive of the Solar neighborhood.
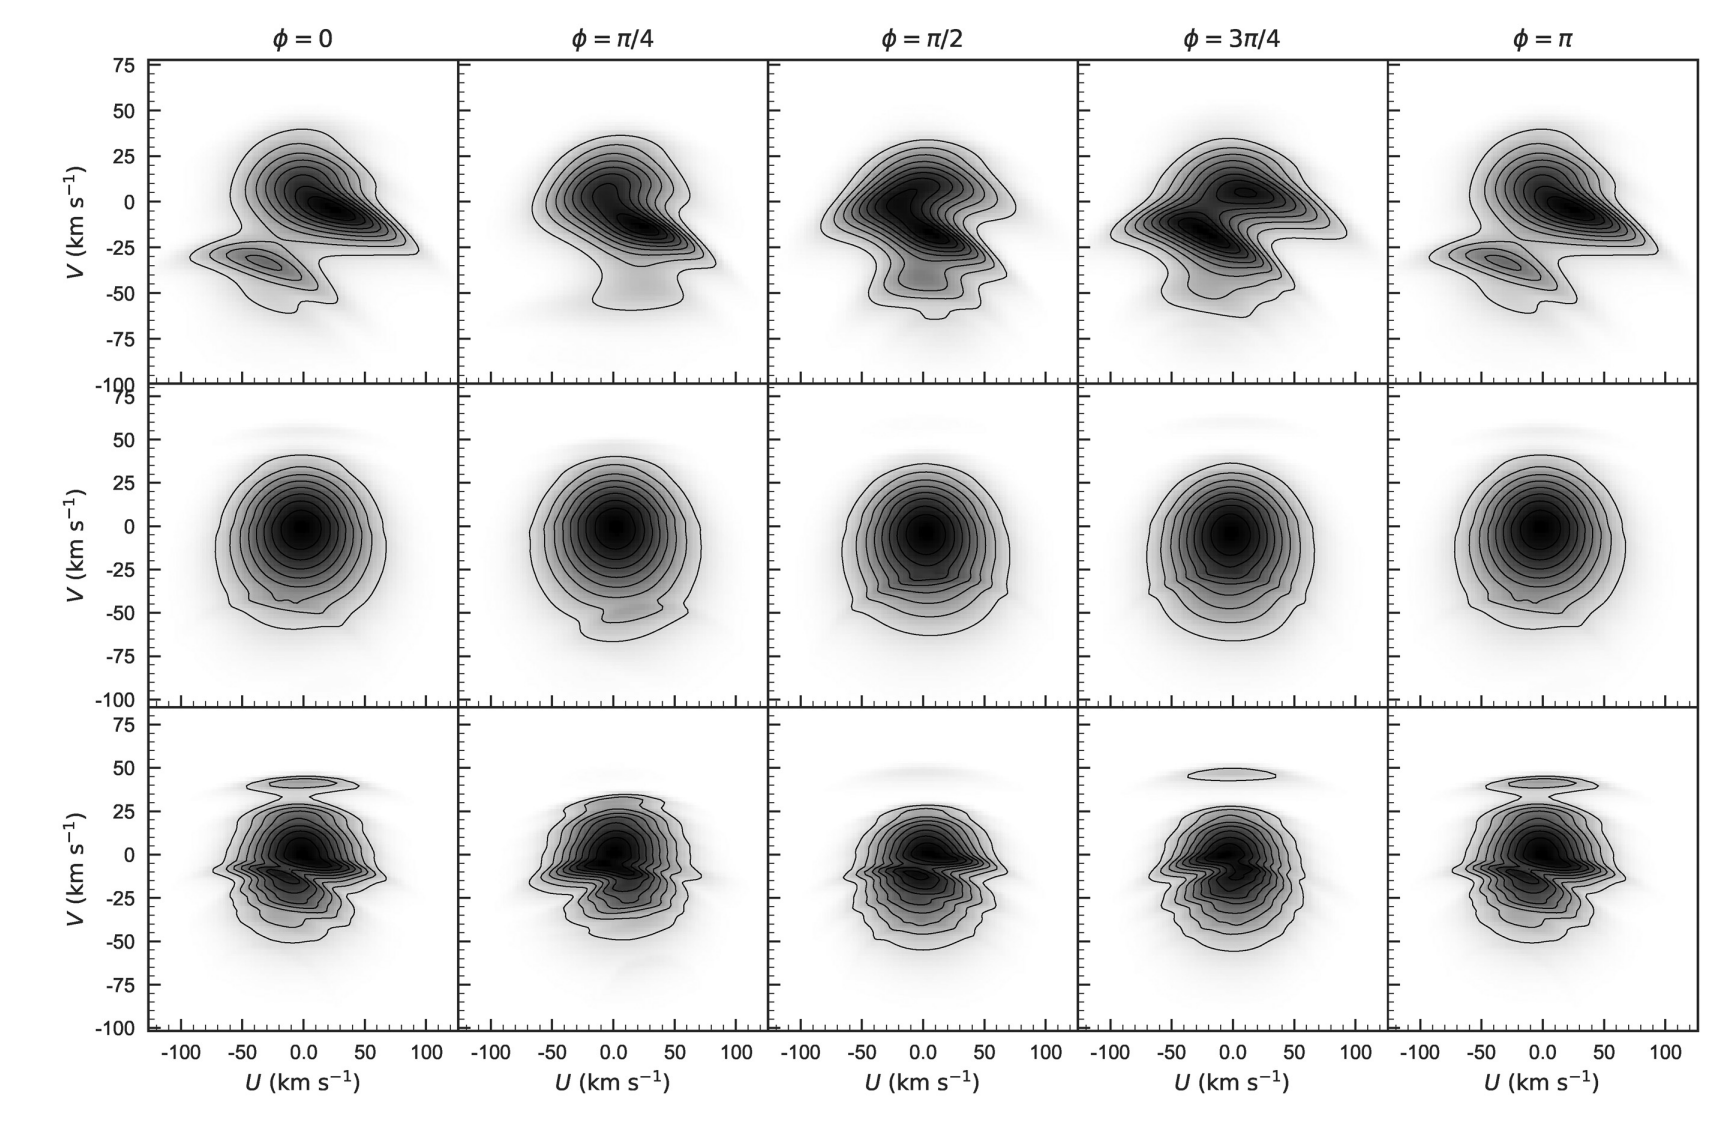
Expected kinematics from a short fast bar (upper row) a long slow bar (middle row) and an intermediate bar with a m=4 fourier component (lower row) for a variety of Galactic azimuths.
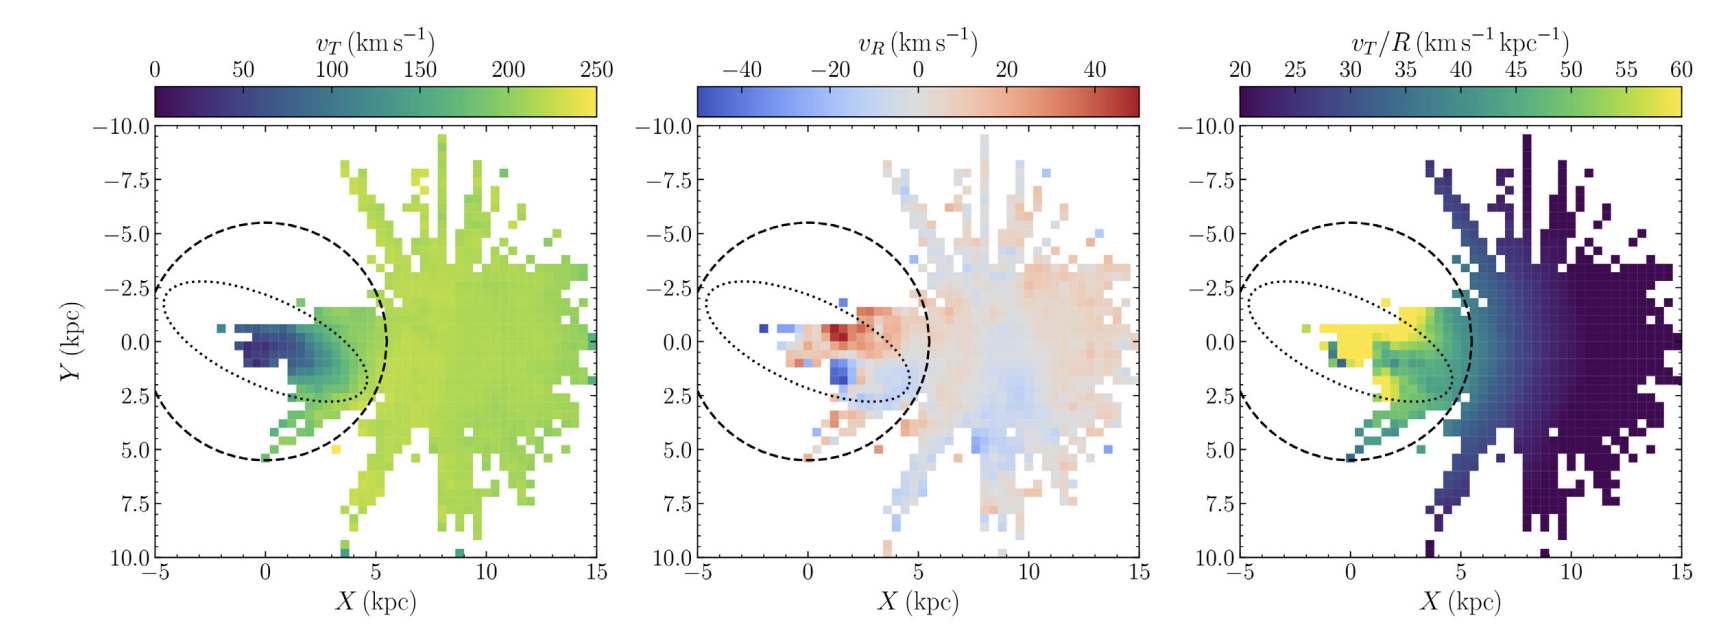
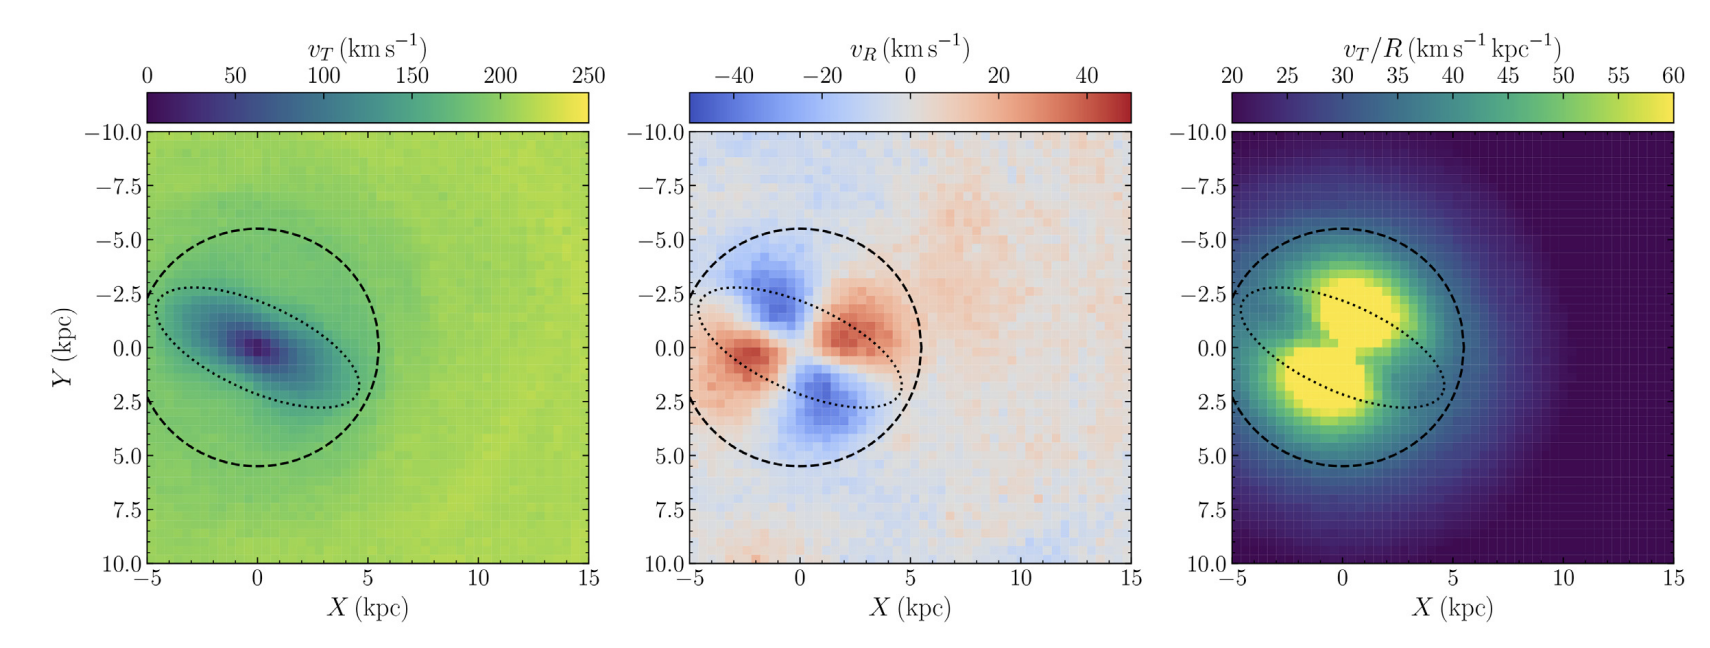
Subsequently, in Bovy, Leung, Hunt et al. (2019) we show the direct kinematic imprint of the galactic bar on the Milky Way, and measure a length and pattern speed consistent with the 4:1 OLR model presented above. The below figure shows the Milky Way disc plane in data from Gaia and SDSS-V APOGEE, combined with astroNN (upper row), and a N-body model (lower row) colored by azimuthal velocity (left), radial velocity (centre) and angular velocity (right). The signature is clearly consistent between model and data, and we make the first observation of the quadrupole (the red-blue signature in radial velocity) as seen imprinted on the disc.
© J. Hunt. All rights reserved. | Plots by J. Hunt unless otherwise specified | Design by TEMPLATED.